

The 14-Handicapper Golf Distance Chart for Men
If you’re a mid-handicap golfer playing regulary you probably aren’t hitting it as far as you think you are—and that’s why you aren’t a 9-handicap yet.
This article will help you make better shot selections, put the right clubs in your bag for your game and ultimately shoot lower scores.
Most golf distance charts for men give you one generic number for each club for all courses and conditions.
We don’t find that very helpful to the average golfer.
So we’ve created three different charts based on data for a mid-range, specifically, 14 handicap male golfers in both the UK and USA.
Why?
We’re fortunate to have 40 years experience playing golf around the World.
From those travels we’ve learnt that out on the course, a 7-iron in the Arizona desert, is not going to perform the same as a 7-iron on a damp Tuesday in Fife, Scotland!
You can see why a single “cover all” yardage number won’t help you make better shot selections or shoot better scores – the data needs to be more flexible to course conditions and climate.
Golf Club Distance Charts for Men: Mid-Handicapper By Course Type
As a quick reference guide we’ve created an average golf distance chart for men playing different course layouts.
Here are the benchmark numbers for our test male golfer who we’ve called “James”.
James’s Personal Details:
Age: 45 years old
Swing Speed: 96mph
Handicap: 14
Fitness Level: Average
Course Type: Mainly plays on parkland courses in the Spring & Summer.
Club Range: Driver to 7 Wood, Hybrid 4, 5-PW*, Wedges 52°-60°
Benchmark golf club distances for men on Parkland, US Resort and Links Courses:
| Club | Average Carry | UK Parkland (Total) | US Resort (Total) | Links Course (Total) |
|---|---|---|---|---|
| Driver | 218 yards | 238 yards | 252 yards | 268 yards |
| 3 Wood | 195 yards | 210 yards | 222 yards | 235 yards |
| 5 Wood | 188 yards | 200 yards | 210 yards | 222 yards |
| 7 wood | 182 yards | 192 yards | 204 yards | 215 yards |
| Hybrid (4) | 175 yards | 185 yards | 195 yards | 202 yards |
| 5 iron | 162 yards | 172 yards | 180 yards | 188 yards |
| 6 iron | 152 yards | 160 yards | 168 yards | 175 yards |
| 7 iron | 142 yards | 148 yards | 156 yards | 165 yards |
| 8 iron | 132 yards | 138 yards | 145 yards | 152 yards |
| 9 iron | 120 yards | 125 yards | 132 yards | 138 yards |
| PW | 108 yards | 112 yards | 118 yards | 122 yards |
| 52° W | 98 yards | 102 yards | 106 yards | 110 yards |
| 54° W | 92 yards | 95 yards | 98 yards | 102 yards |
| 56° W | 85 yards | 88 yards | 92 yards | 95 yards |
| 60° W | 72 yards | 74 yards | 76 yards | 78 yards |
Notes on our Mid-Handicapper Golf Distance Charts for men
- The 95mph Baseline: A 96mph driver swing for a male golfer typically translates to an 80mph 7-iron swing. If your 7-iron is faster, adjust these carry numbers by +3 yards per 2mph.
- Summer Conditions: These figures are based on numbers for average UK summer humidity and temperatures. Weather and faster fairway will result in golf balls not only travelling further in the air but can also result in higher bounce and longer “run” distances. However, this isn’t all good news as you should also account for harder landing on the greens.
- The “Mid-Range” Adjustment: You may notice these numbers sit at the upper end of our “Mid-Range” amateur golfer yardage benchmarks. This is intentional: a 14-handicap with a 96mph swing is physically capable of “Long Hitter” speeds but can lack some strike consistency to achieve those averages every time.

If you’d like to compare your own distances, use our personalised golf distance calculator to enter your personal swing speed, handicap, age, and course conditions.
Why Do golfers Hit the Ball Further on Links Courses?
You’ll notice from the data on our golf distance chart for men above that shots played on a links course have the furthest total distances.
While some golfers assume it’s the wind, the real “secret sauce” of Links golf is fairway firmness.
Here’s why:
1: The “Trampoline” Fairway:
Links course are typically cut into short fescue turf laid on built sand. It doesn’t hold moisture like the clay-based soil and lush grass of a Parkland course.
As a result when the ball hits the tougher ground it retains much of its forward momentum through the initial higher bounce and then into a longer fairway run.
What we’ve found playing on some of the best links courses in the world like those at Costa Navarino in Greece “Bounce and Run” (the distance traveled after landing) can account for up to an additional 30% of total yardage.
Caddie Master Tip: Don’t forget although the Links course will generally give longer total distance the bumps and dips of the natural terrain will also be less controllable than on a manicured parkland fairway.
2: The Wind Factor (A Double-Edged Sword):
I grew up playing on the beautiful but challenging Dunnerholme Golf Course in the UK’s Lake District and quickly got to learn the impact the wind can have on golf yardages!
Dunnerholme like most classic links course layouts is in the traditional up and down design.
This meant that for one hole you may have the wind on your back, the next it can be coming off the left and the next it’s full on in your face!
As you can imagine this dramatically impacts your distances.
Downwind, you might be able to hit a driver 290 yards or even break the magical 300 yard marker! But it can play havoc with approach shots.
Turn into the wind, and you can might struggle to reach 190 yards with your driver!
And who knows what happens when it’s off the left!
That’s why “generic” distance charts don’t give an accurate represenataion for on-course conditions for links golf in particular.
3: Low Trajectory Flyers:
One of the shots regular links golfers need in the bag is a low “Stinger” or “Punch”.
This keeps the ball beneath the worst of the wind and helps maintain distance.
By giving the ball a lower launch angle you can create a shallower landing “pitch”and there is also less “grab” from the shorter turf maximising the run once the ball hits the deck.

Golf Distance Charts: A Top Caddie Tip on Climate Change Impact
I’ve been fortunate to play on courses all round the world in all different climates and conditions.
Let me share a top tip a caddie in Dubai gave me as a younger golfer.
He noticed I was over clubbing on my approach shots.
On the next hole my caddie suggested I try to drop down one club from a 5 iron to a 6 or even 7.
The ball landed in the heart of the green and I made the putt!
My caddie explained the mistake was common amongst golfers from the UK who travel to dryer climates.
In the UK, especially in winter the colder damper air is “heavy.”
When the temperature drops from 25°C to 10°C, you will lose approximately 1 club in distance – obviously the same is true in reverse.
If the temperature rises from 18°C to 30°C in desert conditions you gain a club!
We also found this to be true at our recent Greencard event in Canada.
We had multiple rounds in the higher altitude mountains like Banff and Whistler.
During those rounds the ball flew further than when we hit the same shot in the UK.
The best amateur players realise the difference air density and temperature make to the flight of the golf ball and slightly adjust their club yardages accordingly.
Is Your “Golfers Ego” Ruining Your Scorecard?!
We might not like to admit it but golf distances for men are often ruined by….ego!
It’s a scenerio we’ve seen many times on our events
Mid-handicap players like our friend “James” watch their rival but longer hitting playing partner strike a 8 iron 152 yards into a green.
Not to be outdone, “James” pulls on the memory that he once “pured” a 7 iron 160 yards. He forgets that was 5 years ago, on his home course, playing downwind and on rock hard fairways of July!
James’s real “stock” yardage for a 7 iron is 148 yards, but in denial he still hit the shot with an 8 iron!
Predictably, he finds himself in a greenside bunker and walks off with a bogey rather the par or even birdie his tee shot deserved – points lost!
CADDIE MASTER TIP: Don’t let ego ruin your scorecard – be a “smart golfer” play the 7 iron 148 yardage your personal distance chart tells you – you’ll hit more greens and get more birdies!
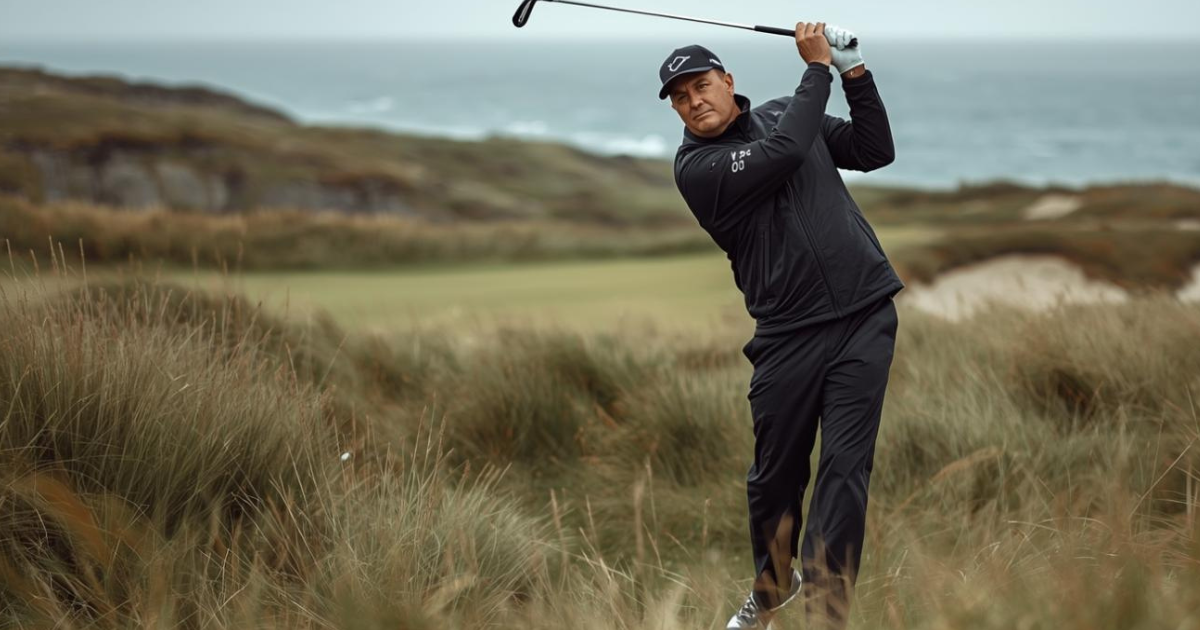
Surviving the Links: Scoring Tips for Windy Conditions
In Links golf the wind isn’t just an “extra variable”—it becomes the defining feature of the round.
On a firm links course, wind effects are exaggerated.
A headwind doesn’t just stop the ball; it creates more backspin, causing the ball to “balloon” and drop vertically.
Conversely, a tailwind reduces spin, creating a flatter flight that hits the ground running.
And teeing off into a blustering crosswind can easily end up with your second shot being played from a neighbouring fairway!
You can see how this will play havoc with your standard yardage charts and why those generic distance charts are not really that helpful.
Below we’ve pulled together data to create potential golf yardage charts for different wind conditions. For the purposes of this chart we’ve assumed a “Standard” 10–15 mph wind, which is a typical links course breeze on the UK or Irish coast and the Eastern seaboard of the USA.
| Club | Headwind | Downwind | Crosswind (Drift) | Benchmark |
|---|---|---|---|---|
| Driver | 205 – 225 yds | 290 – 310 yds | 245 – 260 yds | 268 yards |
| 3 Wood | 180 – 195 yds | 250 – 265 yds | 215 – 230 yds | 235 yards |
| 5 Wood | 165 – 180 yds | 235 – 250 yds | 205 – 215 yds | 222 yards |
| 7 wood | 155 – 170 yds | 225 – 240 yds | 195 – 205 yds | 215 yards |
| Hybrid (4) | 145 – 160 yds | 215 – 225 yds | 185 – 195 yds | 202 yards |
| 5 iron | 135 – 150 yds | 200 – 210 yds | 170 – 185 yds | 188 yards |
| 6 iron | 125 – 140 yds | 185 – 195 yds | 160 – 170 yds | 175 yards |
| 7 iron | 115 – 130 yds | 175 – 185 yds | 150 – 160 yds | 165 yards |
| 8 iron | 105 – 120 yds | 160 – 170 yds | 140 – 150 yds | 152 yards |
| 9 iron | 95 – 110 yds | 145 – 155 yds | 125 – 135 yds | 138 yards |
| PW | 85 – 100 yds | 130 – 140 yds | 115 – 125 yds | 122 yards |
| 52° W | 75 – 90 yds | 115 – 125 yds | 100 – 110 yds | 110 yards |
| 54° W | 68 – 82 yds | 108 – 118 yds | 92 – 102 yds | 102 yards |
| 56° W | 60 – 75 yds | 100 – 110 yds | 85 – 95 yds | 95 yards |
| 60° W | 45 – 60 yds | 85 – 95 yds | 70 – 80 yds | 78 yards |

Caddie Master “Smart Golfer” Tips for Mastering the Links Wind
1. “When it’s Breezy, Swing Easy”
The biggest mistake golfers not experienced with Links golf make is to swing harder into a headwind.
Harder swings create more backspin, and spin is the wind’s best friend.
More spin causes the ball to climb higher, where the wind is even stronger.
It might be counter-intuitive but when hitting into the wind a “Smart Golfer” takes two extra clubs and swing at 75% effort.
2. The “Stock” Wind Formulas
-
Headwind: Add 1 yard for every 1 mph of wind. (A 150-yard shot into a 20 mph wind plays like 170).
-
Tailwind: Subtract 0.5 yards for every 1 mph of wind. (A 150-yard shot with a 20 mph tailwind plays like 140).
-
Caddie Master Tip: Often the wind “hurts” more than it “helps.” Links golf is a thinking golfers game so take your time over club selection and choose when to hit as the wind direction suits your shot selection.
3. Don’t Fight the Crosswind—Ride It
Amateurs often try to “hold” the ball against a crosswind by aiming straight and trying to hook/slice it back.
This is high-risk. Instead, aim “into the teeth” of the wind and let it drift the ball back to the target.
If the wind is blowing left-to-right, aim 20 yards left and let the wind be your caddie.
4. Ball Position is Key
To keep the ball “under” the wind, move your ball position one inch back in your stance.
This naturally de-lofts the club and creates a lower, more piercing trajectory (the “Stinger”).
5. Putting in the Wind
On exposed links greens, the wind can actually move your ball on the ground.
Widen your stance for better stability and “trap” the putt with a slightly firmer stroke to prevent the wind from taking the ball offline.

How Do Swing Speeds Change as Golfers Age?
Swing speed is the “engine” of your golf game, determining the maximum potential energy you can transfer to the ball at impact.
As golfers especially male golfers swing speed drops significantly as we get older – but that doesn’t mean we necessarily have to swing harder to avoid losing huge yardages or see an impact on our scoring.
For a 14-handicapper like “James”, the true secret to distance isn’t just moving the club faster—it’s strike consistency and accauracy to make sure that speed isn’t wasted on off-center strikes.
Here are some benchmark swing speeds for 14 handicap golfers by age:
| Age | Target Swing Speed (Driver) | Estimated Carry (Yards) | Typical Speed Loss % |
|---|---|---|---|
| 20–29 | 98 – 102 mph | 230 – 245 yards | Baseline |
| 30–39 | 96 – 100 mph | 225 – 240 yards | -2% |
| 40–49 | 94 – 98 mph | 220 – 235 yards | -5% |
| 50–59 | 90 – 94 mph | 210 – 225 yards | -8% |
| 60–69 | 86 – 90 mph | 200 – 215 yards | -12% |
| 70+ | 80 – 85 mph | 185 – 200 yards | -18% |
Watch This Video Explaining Swing Speed Benchmarks for Amateur Golfers
How to Keep Golf Swing Speed Longevity
Why the Speed Drops…And How to Fights It!
It isn’t just “getting older” that slows Golfers Swing Speed down; it’s specific physiological changes that we can actually :
-
Rotational Range:
Most 14-handicappers lose speed because their hips and upper back (thoracic spine) stiffen.By working on maintaining flexibility through excercise and stretching, you can keep those “50-year-old” swing speeds well into your 60’s – it just takes more work than when we were in our 30’s!!
-
Strike Cosistency:
As we pass that magic 50 mark and we really start to feel the impact of a slower swing.Smart Golfers won’t just try to swing the club as hard as possible they compensate for that lower clubhead speed by focusing on hitting the center of the face more consistently.
Why the Speed Drops…And How to Fights It!
-
Equipment Optimisation for Senior Golfers:
If you are a regular reader of our Smart Golfer series you’ll know we are big fans of a 7-wood! becomes vital.As swing speed drops below 90 mph (typically in the 60+ bracket), long irons become almost impossible to launch.
Switching to high-launch woods allows James to maintain his 14-handicap scoring even as the radar numbers dip.

What is Smash Factor in Golf?
If you’ve used a launch monitor like Trackman or indoor simulator studio you’ve probably seen figure for something called “Smash Factor”.
Sounds a bit of a vanity metric, but it actually can be quite informative.
In Golf Smash Factor is simply your Ball Speed divided by your Clubhead Speed.
Here are some “Smash Factor” benchmarks for our 14 handicapper hitting his driver:
-
The Pro Goal: 1.50.
-
The 14 Handicapper Reality: 1.42.
Caddie Master Tip: Again don’t let ego ruin your round. Play your own game and remeber a golfer swinging at 90 mph with a center strike will consistently outdrive a 100 mph “slasher” who misses the sweet spot.

Golf Distance Charts for Men: Our Experience of Golf in the USA!
One of our favourite places to travel with our golf clubs is the USA – the variety and quality of the courses across every State is incredible.
The other major benefit of golfing at the high-end US Resort courses (like those in Arizona, Florida, the Carolina’s or California), is that it often feels like we’ve gained a “superpower” with our golf distances when compared playing at home in the UK.
Unfortunately, it has nothing to do with us!
Here are four science-backed reasons why we often hit the golf ball further in climates similar to those found in warmer dryer States of North America:
1. The “Air Thinness” Factor (Altitude)
Many famous US golf destinations are at significantly higher elevations than the sea-level parklands of the UK.
-
The Science: At higher altitudes, the air is less dense. This means there are fewer air molecules to create drag on the ball as it flies.
-
James’s Gain: For every 1,000 feet of elevation, James gains about 1% in distance. If he’s playing in Scottsdale (approx. 1,200ft) or Denver (5,280ft), his 150-yard 7-iron suddenly carries 152 to 160 yards without him swinging any faster.
2. Temperature and Air Density
The US is generally much warmer than the UK, especially in the “Golf Belt.”
-
The Science: Warm air is less dense than cold air. Additionally, a warm golf ball is more elastic; the core compresses more efficiently, transferring more energy from the clubface.
-
The “Rule of 10”: A common rule for James is that for every 10°C (18°F) increase in temperature, he gains about 2–3 yards on his drive. Moving from a 10°C UK morning to a 30°C Florida afternoon is an automatic 6-yard gain.
3. Turf “Spring” and Grass Types
US Resort courses often use different grass species than UK Parkland.
-
Bermuda & Zoysia: In the southern US, courses often use Zoysia or Bermuda grass. These grasses are stiffer and “grainier.”
-
The “Tee” Lie: On a Zoysia fairway, the ball often sits up high—almost like it’s on a tiny natural tee.
This allows golfers to make cleaner contact, whereas on a soft, damp UK Parkland (Ryegrass/Poa), the ball can sit “tight” or “heavy,” making it harder to catch cleanly.
4. Irrigation and “Resort Conditioning”
While a UK Parkland course relies heavily on natural rainfall (making it soft and “receptive”), US resorts spend millions on sophisticated drainage and irrigation.
-
The “Hero” Roll: Resort fairways are often kept firm and fast to ensure guests have a “fun” experience.
If the ground is dry and the grass is cut short, we get more roll-out on even a badly struck shot.
-
The Contrast: In the UK, a drive might land and stop within 5 yards because the ground is soft.
In a dry US climate, that same drive hits the “hard-pan” and rolls on for a further 25 yards.
Yardage Differences Between UK Parkland & US Resort Courses
As a quick reference guide here are the difference in yardages you need to allow for if you playing a US course compared to a UK parkland course.
Obviously, if you are travelling in reverse (US to the UK), you need to take off the yardage from your usual club distances.
| Variable | UK Parkland (Typical) | US Resort (Typical) | Allow for |
|---|---|---|---|
| Air Density | Thick/Heavy | Thin/Light | +5-8 Yards |
| Ball Elasticity | Low (Cold Ball) | High (Warm Ball) | +2-3 Yards |
| Fairway Roll | Minimal (Soft) | Significant (Firm) | +10-15 Yards |
| Total Distance | 238 Yards | 252+ Yards | +14 Yards |

Frequently Asked Questions: Golf Distance Charts for Men
Our data-backed benchmarkshow a 14-handicap male with a 95-98 mph swing speed typically carries the ball 218 yards.
There are a number of variables that will determine consistant shot yardages which is why we use real-life data to create shot distances for different golfers and course conditions.
For example depending on conditions, this results in a total distance of 238 yards on UK Parkland and up to 268 yards on a firm Links course.
It’s all about “Ground Reactivity.” Links turf is sand-based and incredibly firm.
While a Parkland fairway absorbs the ball’s energy stopping it quickly and reduce “roll-out”.
Comparitively a Links fairway acts like a runway, allowing the ball to “scud” and roll, often adding 40+ yards to a drive.
Cold winter air is denser, creating more aerodynamic drag on the golf ball.
Combined with softer ground that limits roll, most golfers lose 10-15 yards of total distance.
We recommend “clubbing up” by at least one full iron when the temperature drops below 10°C.
“Smash Factor” measures Ball Speed divided by your Clubhead Speed.
In very simple terms it shows how efficiently you are using your Clubhead speed through the ball.
In general terms the higher the Smash factor the greater the more speed you are putting into the ball and the further your yardages.
While Pros aim for 1.49-1.50, a 14-handicap golfer should strive for 1.42 to 1.45.
This indicates you are making efficient contact near the center of the face, maximizing your current swing speed.
Thinner air at higher altitudes reduces drag on the golf ball.
A general rule for mid-handicap golfers is that you gain 1% of distance for every 1,000 feet of elevation.
On a mountain course at 3,000ft, his 150-yard shot will naturally travel 154-155 yards.
Carry is the distance the ball travels in the air.
Knowing your carry allows you to safely clear bunkers and water hazards.
Total distance is a “bonus” that depends on how the turf is feeling that day.
The short answer is probably not for most courses.
The distance gap between the two clubs is too small at approximately 6 yards.
For a mid-handicapper, it is more efficient to carry a 52° or 54° for full shots and a 58° or 60° for green-side utility.
This bag selection gives space for a more “useful” club like a 7-wood to cover long irons at the top of the bag.
General advice from our Pro Golfer Panel is that you should review your distances whenever your swing speed, fitness level, equipment, or playing conditions change — or at least once per season.
Many golfers also choose to recheck distances after lessons, strength training, or switching golf balls.
Popular Distance Resources from Greencard Golf
YOU MIGHT ALSO BE INTERESTED IN…